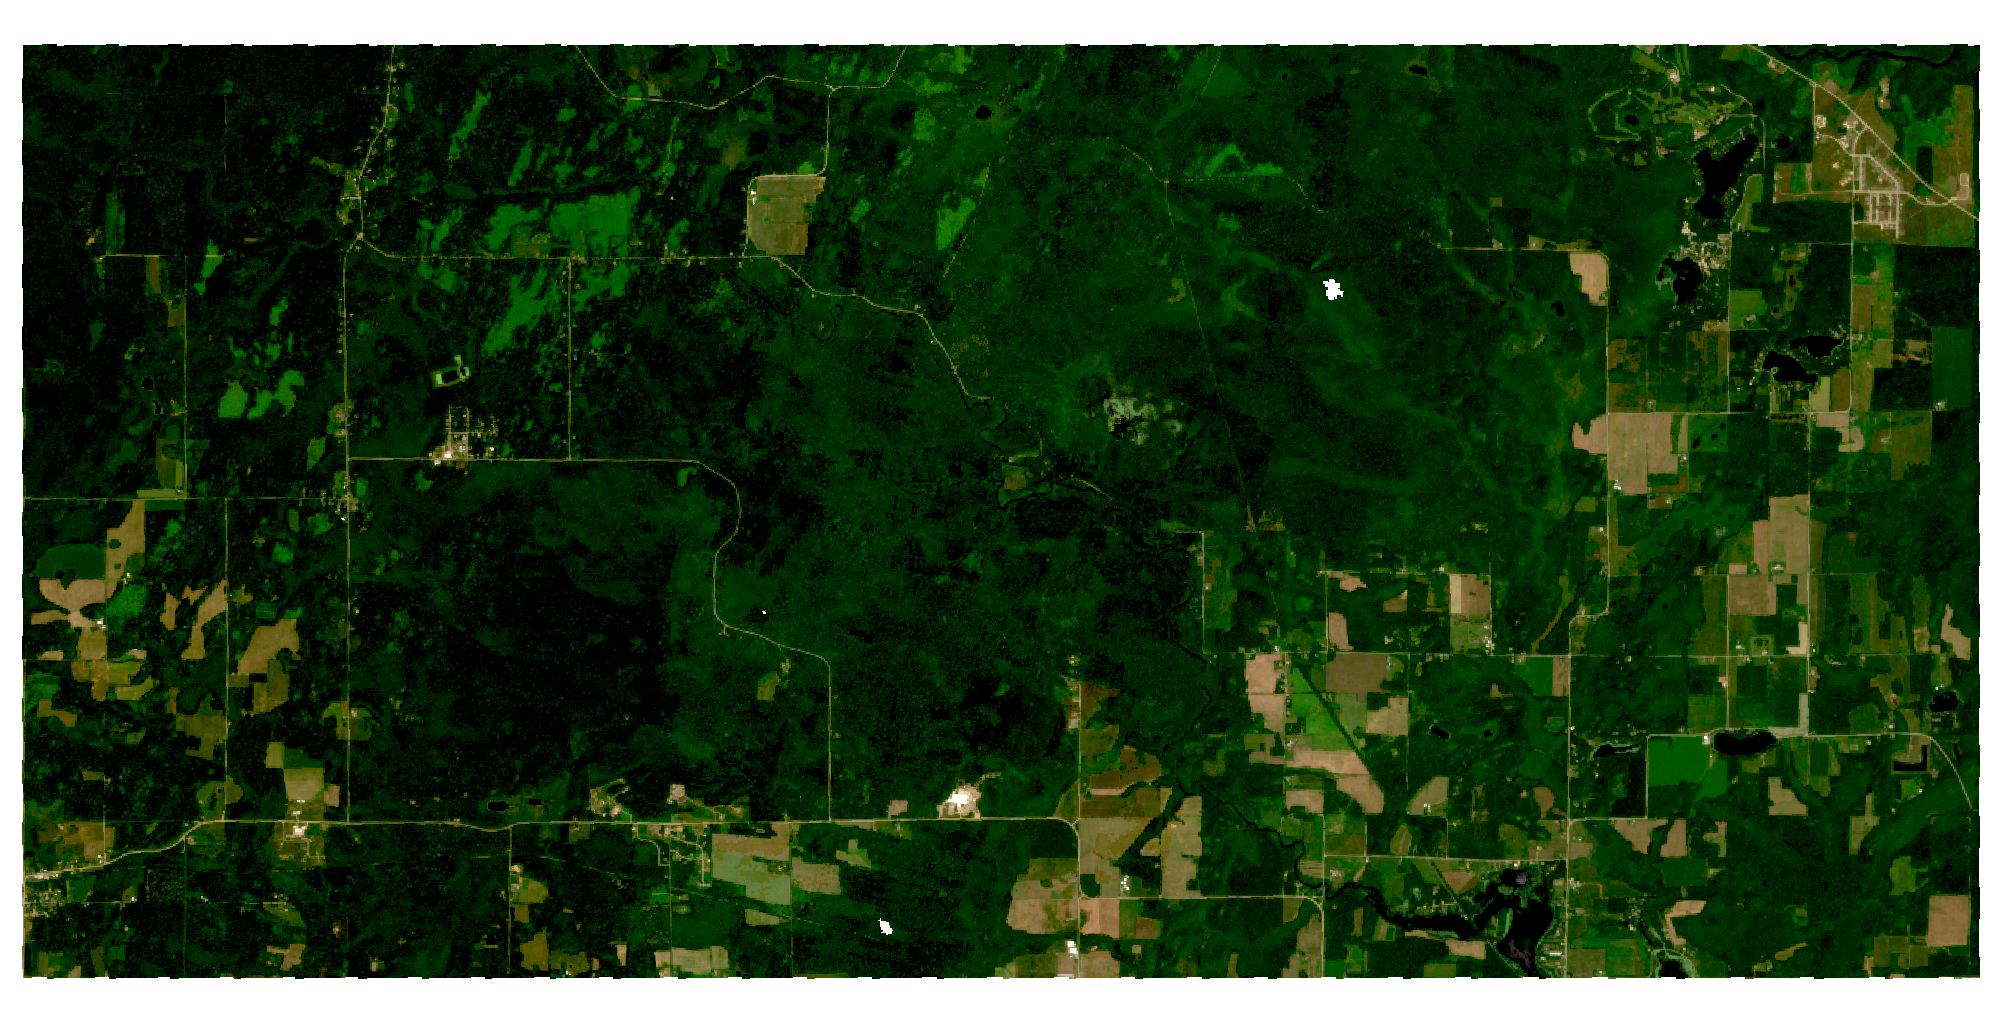
Original PlanetScope RGB mosaic of the Stockbridge–Munsee study area, July 3, 2025

A forest.
A closer look.

Five years of change.
A living atlas of the evidence.

Change is a signal.
Evidence tells the story.

A shifting spectral signal is a place to begin. Follow observations through time, inspect how models interpret them, and see where the evidence reaches its limits.

99satellite scenes
26observation dates
5years in view

Five years.
One landscape.

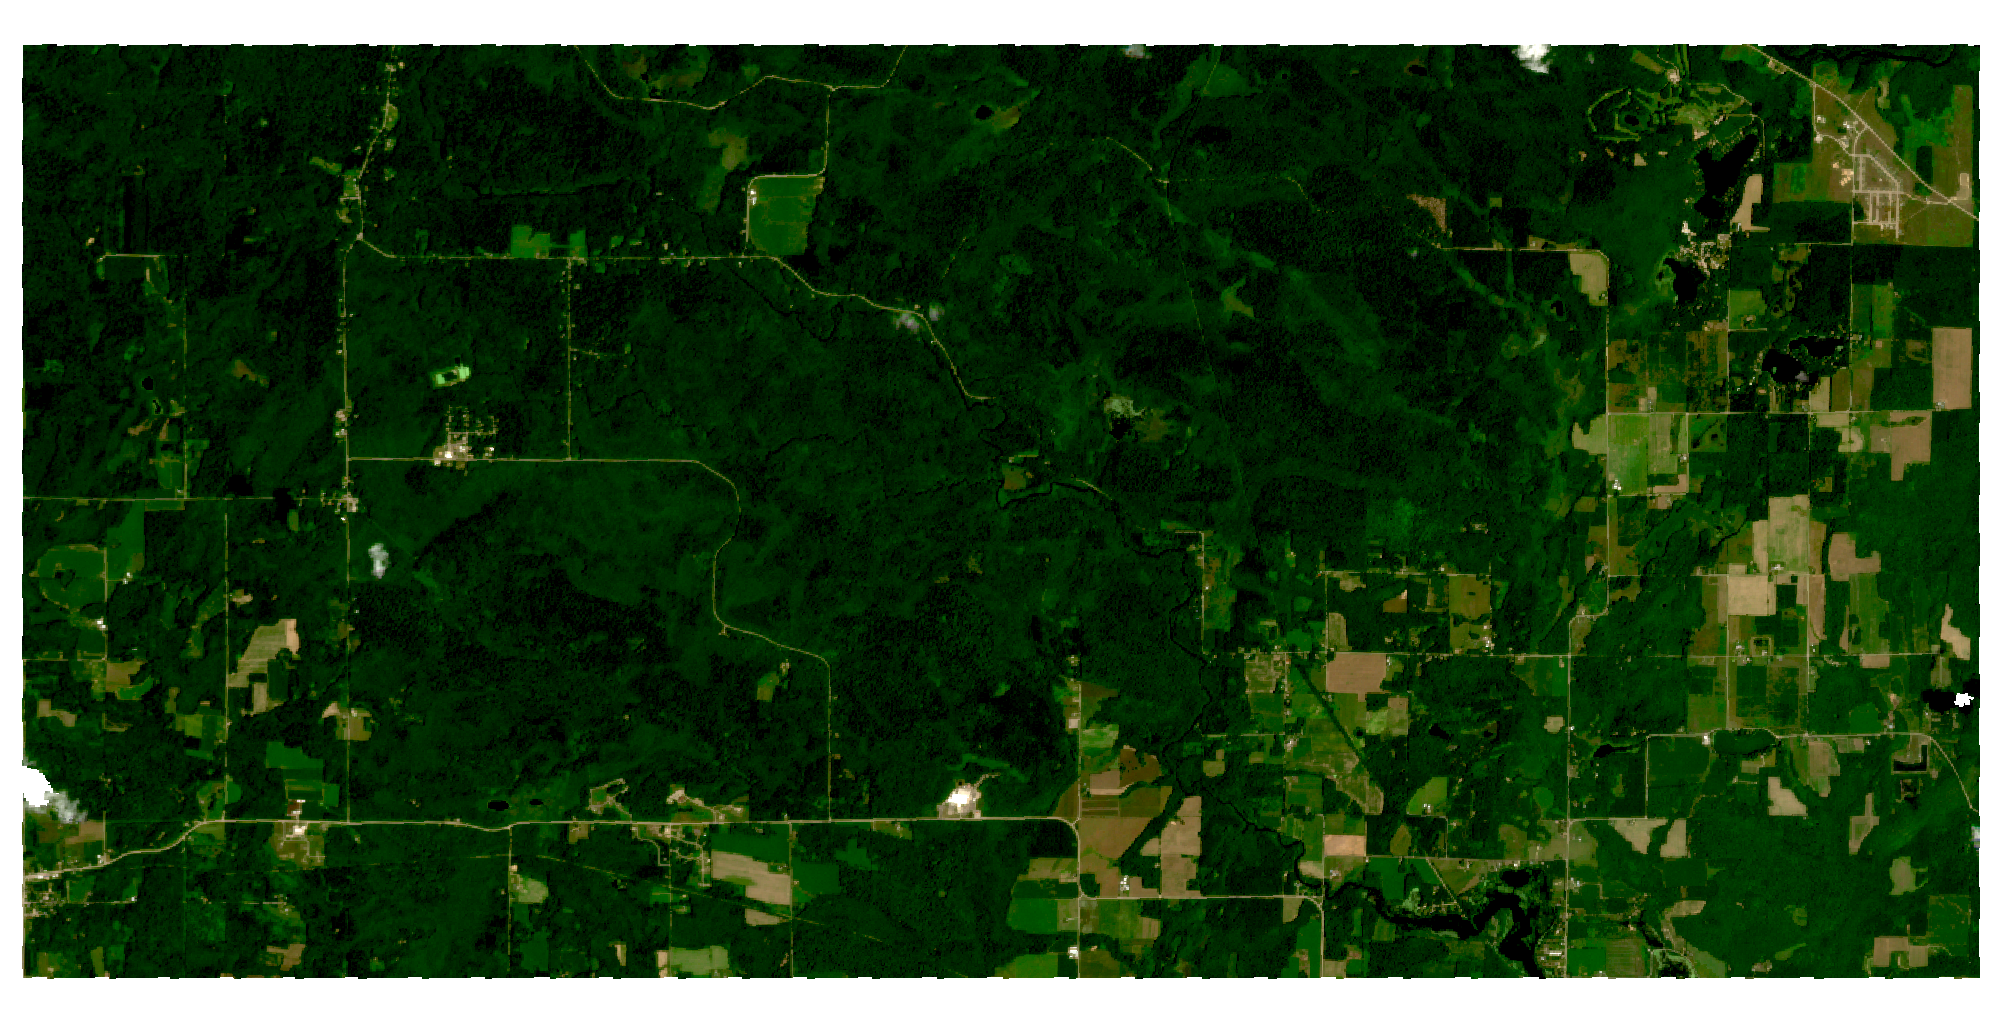
Two July observations, in the same true-color RGB view.
Move the divider and look for yourself.

Original PlanetScope RGB study area mosaic from July 3, 2025
2025July 3 · RGB
Original PlanetScope RGB mosaic of the same study area on July 11, 2021
2021July 11 · RGB
Loading both dated observations…
True-color RGB · Shared display settingsColor differences alone do not establish forest loss.

Look closer.
Go all the way in.

Move from the map to each cell’s calculation,
then inspect the fixed regional evidence on its own page.

Forest Change / Research atlasOpen workspace
Real satellite base layer available in the interactive research atlas
Stockbridge–Munsee study area

What changed
at this cell?

Choose a location. Inspect its trajectory. Follow the evidence.

Linked research pagesCell-level observationsDownloadable evidence

Every score
has a trail.

Methods, observations and limitations stay attached to the result. Explore the original research evidence in full.